search

April 2, 2025

In non-compartmental analysis (NCA), the area under the concentration-time curve (AUC) is a key parameter used to quantify total drug exposure over time.  Along with Cmax,  AUC is a fundamental parameter for assessing systemic drug exposure and is commonly used for comparisons in pharmacokinetic studies. For instance, in bioequivalence trials, statistical analysis relies heavily on comparing AUC and Cmax between different formulations. While the mathematical principles behind AUC calculation are straightforward, the choice of method can introduce nuances that are often overlooked.

Although AUC can be calculated from primary pharmacokinetic parameters such as clearance (CL) and volume of distribution (V), in this blog, I focus only on numerical estimation of AUC using non-compartmental analysis techniques —all of which are available in Phoenix WinNonlin.

Linear trapezoidal method

The linear trapezoidal method estimates AUC by applying linear interpolation between concentration-time data points. In simple terms, it connects adjacent concentrations with straight lines, forming trapezoids, and sums their areas to calculate the total AUC. For a given time interval (t1 – t2), the AUC is calculated as:


Here, the first two terms represent the average concentration over the time interval, while (t1 – t2) is the duration of the time interval. The linear method applies the average concentration across the entire time interval.

By summing AUC values across all intervals, you obtain the total drug exposure from the first to the last time point. Dividing this total AUC by the total elapsed time provides the average drug concentration in the body over the study period.

The linear trapezoidal method is simple to implement, requiring only basic arithmetic. It was the first method historically used but can overestimate AUC, as it does not account for the exponential decline of drug elimination.

Logarithmic trapezoidal method

The logarithmic trapezoidal method calculates AUC using logarithmic interpolation between concentration-time data points. This method is particularly useful when concentrations are decreasing, as first-order drug elimination follows an exponential decline, which appears linear on a logarithmic scale. For a given time interval (t1 – t2), the AUC is calculated as:


This method assumes that C1 > C2 And provides a logarithmic average of the two concentrations. Similar to the linear method, the average concentration is multiplied by the time interval.

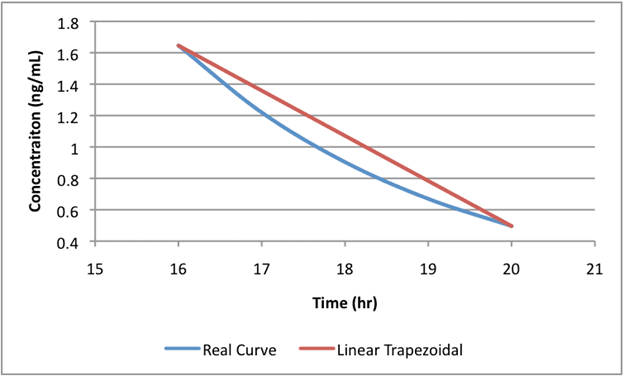
The figure below illustrates the difference between the linear and logarithmic trapezoidal methods. The blue line represents the true mono-exponential decline of drug concentration, while the red line shows the AUC estimation using the linear trapezoidal method. Since the linear trapezoidal method assumes a straight-line decline between sampling points (at 16 and 20 hours), it overestimates drug exposure, as seen by the red line sitting above the blue line.

Chart showing decreasing concentrations over time using real curve and linear trapezoidal measurements

As illustrated above, the logarithmic trapezoidal method is more accurate for decreasing concentrations, as it accounts for the exponential nature of drug elimination; however, when sampling points are closely spaced, the difference between this method and the linear trapezoidal method is less pronounced.

Linear-log trapezoidal method

This is a combination of the first two methods and is also called “linear-up log-down”. When concentrations are increasing (as in the absorption phase), the linear trapezoidal method is used. When concentrations are decreasing (as in the elimination phase), the logarithmic trapezoidal method is used. This method is thought to be the most “accurate” because the linear method is the best approximation of drug absorption while logarithmic decline is best modeled by the logarithmic trapezoidal method during drug elimination.

Dose the choice of AUC calculation method matter?

Yes, the choice of AUC calculation method matters, and it is important to state which method was used. Its impact depends largely on sampling frequency. With frequent sampling (closely spaced time points), the difference between methods is minimal, as the gaps between concentrations are small. With widely spaced time points, the choice of AUC method becomes more critical, as the linear method can overestimate AUC in the elimination phase by assuming a straight-line decline, while the log method can underestimate AUC in the absorption phase.

In addition, partial AUCs —which measure drug exposure over a specific time interval—are also influenced by the chosen AUC calculation method. Since partial AUCs are often required at time points that were not directly sampled, estimating the concentration at a desired time point is necessary. Non-compartmental analysis methods achieve this through interpolation between observed concentration data. The accuracy of this interpolation depends on the selected AUC method, which assumes either a linear (straight-line) or logarithmic relationship between data points.

In summary, the Linear-Up / Log-Down method is often considered the most accurate because it applies the linear method for rising concentrations (absorption phase) and the log method for declining concentrations (elimination phase).

How are these AUC methods implemented in Phoenix WinNonlin?

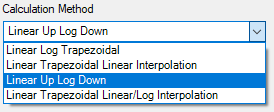
In Phoenix WinNonlin, the Non-Compartmental Analysis (NCA) object provides four AUC calculation methods, each affecting how total and partial AUCs are computed.

Software menu with dropdown options

1. Linear Log Trapezoidal: uses the linear trapezoidal method up to Cmax and then switches to the log trapezoidal method for the remainder of the curve. When computing partial AUCs after Cmax, concentrations are estimated using logarithmic interpolation. Otherwise, linear interpolation is applied.

2. Linear Trapezoidal Linear Interpolation: applies the linear trapezoidal method for AUC all calculations. For partial AUCs, concentrations are estimated using linear interpolation, and linear extrapolation is used beyond the last observed concentration.

3. Linear Up Log Down: uses the linear trapezoidal method when concentrations are increasing and the log trapezoidal method when concentrations are decreasing. For partial AUCs, linear interpolation is applied if the surrounding concentrations are increasing, while logarithmic interpolation is used if concentrations are decreasing. This method does not depend on Cmax, making it more flexible for profiles with secondary peaks.

4. Linear Trapezoidal Linear/Log Interpolation: uses the linear trapezoidal method for AUC calculation. It differs from the Linear Trapezoidal Linear Interpolation method just when partial areas are selected at an endpoint that is not in the dataset. In that case, a logarithmic interpolation is used to insert points after Cmax.

Choosing the right method in Phoenix WinNonlin

As discussed earlier, the choice of AUC calculation method affects both total and partial AUC estimations, particularly the Linear-Up / Log-Down method is often considered the most accurate because it automatically applies the appropriate interpolation method based on whether concentrations are rising or falling.

By default, Phoenix WinNonlin selects the Linear Trapezoidal (Linear Interpolation) method, but users can choose a different method in the NCA object and even modify the system default. For more details on these methods and their applicable rules, refer to the Phoenix documentation.

If you would like to learn more, this concept is covered in Certara University’s Phoenix WinNonlin (Part 1) NCA Certification Course (Code 122).

Ana Henry, Executive Director, Certara University
Ana Henry

Executive Director, Training & Certara University

Ana leads the Certara University team in providing modeling and simulation for new drug development through education, skills, and expertise in the global healthcare industry. Ana has more than 20 years experience in a variety of roles in the industry. She has extensive experience in pharmaceutical training, software demonstration, software support, and product management, Ana is also an adjunct faculty member at Skaggs College of Pharmacy and Pharmaceutical Sciences at the University of Colorado.

This blog was originally published in April 2011, and has been updated for accuracy.

Contact us